

01
Replay analysis
Index your .rep library offline. Summary, hotkeys, graphs, build order, simulation, profiles, and maps — deep captures run in the background.
Ultraseer
Ultraseer is 3-in-1: local replay analysis, a completely different way to watch .rep files, and an overlay for live observer games and your own replays.
3-in-1 Windows app
Ultraseer is local StarCraft analysis, watching, and overlay — no upload, no wait.
01
Index your .rep library offline. Summary, hotkeys, graphs, build order, simulation, profiles, and maps — deep captures run in the background.
02
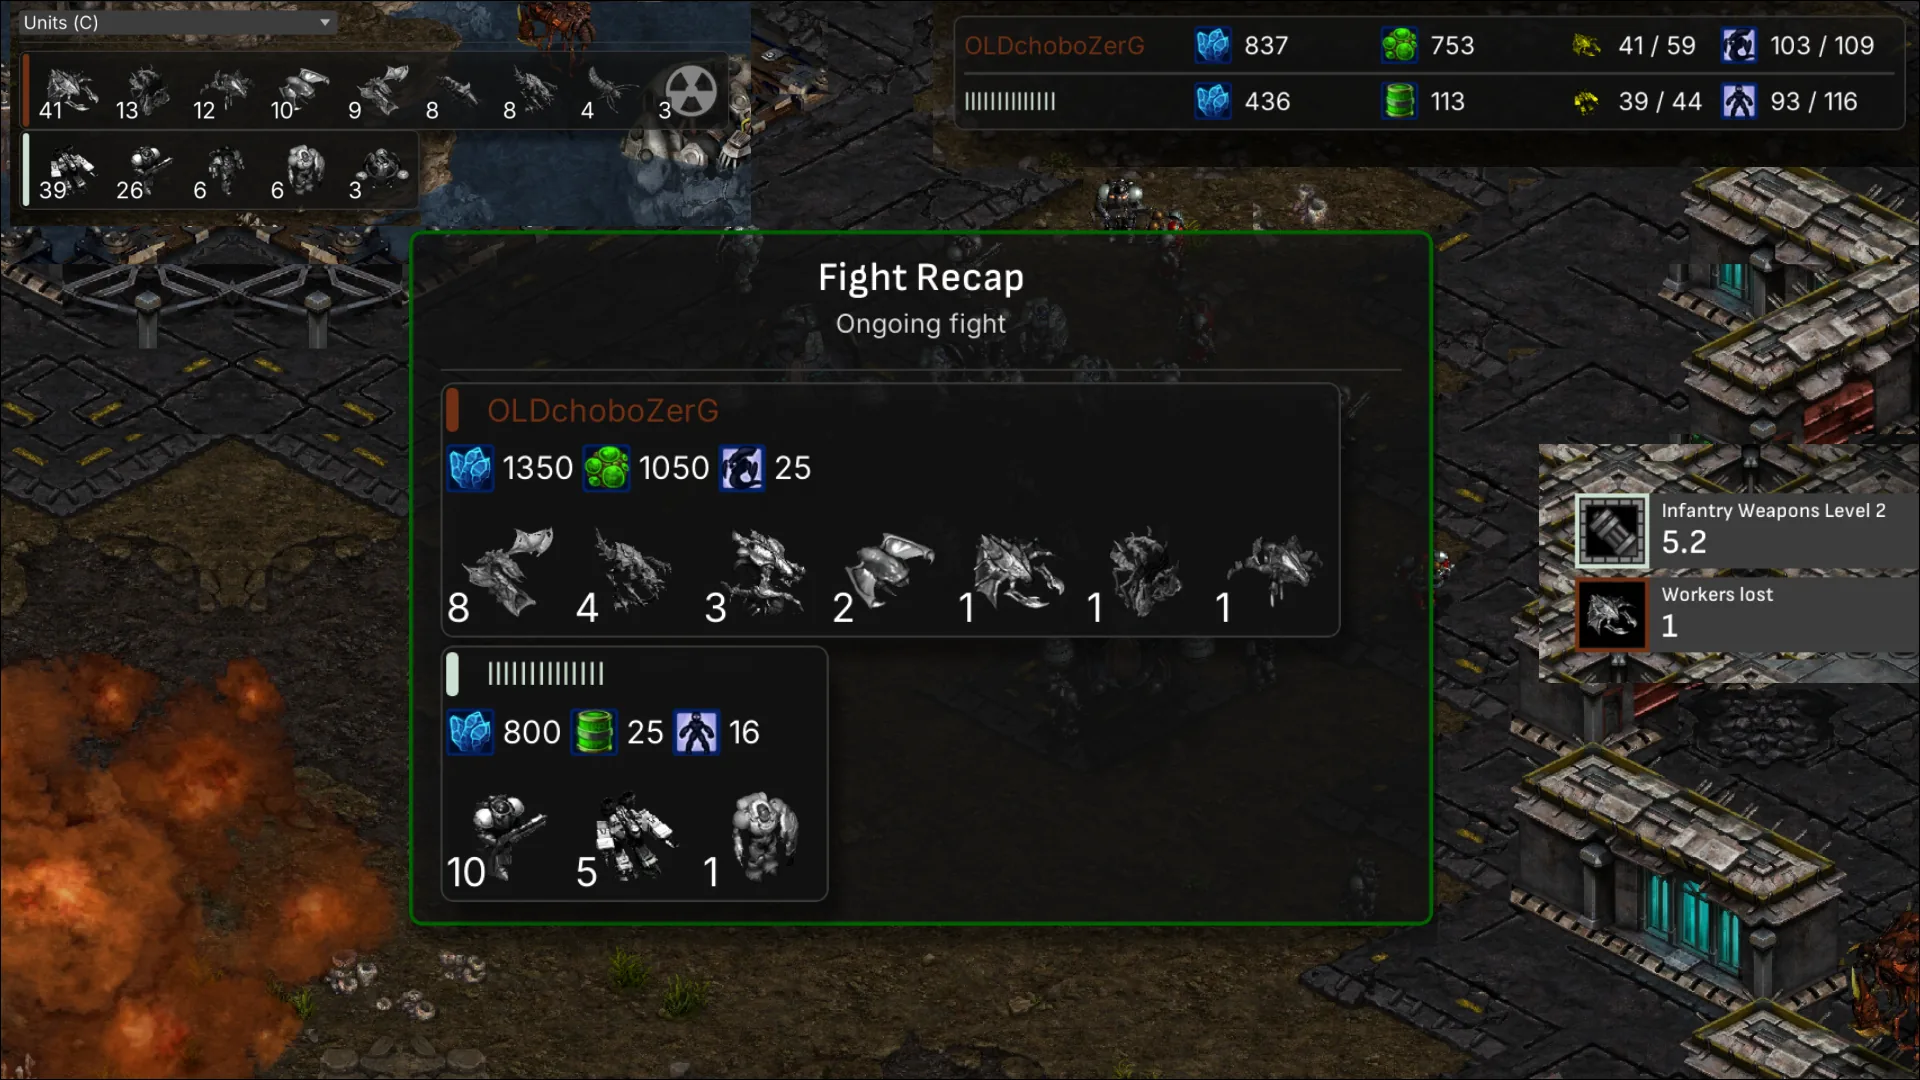
Watch 1v1 replays inside StarCraft: Remastered with live fight recaps, economy HUD, production, APM, and a dozen overlay panels.
03
Attach the same HUD to live observer games and to replays you open in SC:R — production, units, upgrades, and alerts without leaving Battle.net.
Website
Drop a Brood War replay (.rep only) for a shareable analysis page on tesagi.com.
Community
Latest build orders shared by players.
No build orders have been shared yet.
Features
On tesagi.com: summary analysis on every upload. Go deeper with minerals — production queue, profile stats, HUD timelines, and frame-by-frame simulation.
Full production queue per player — time, supply, and unit icons from deep analysis.
| Time | Supply | Image | Unit |
|---|---|---|---|
| 0:18 | 8 |  | Hatchery |
| 0:25 | 9 |  | Overlord |
| 0:50 | 12 |  | Lair |
| 1:00 | 14 |  | Zergling |
| 1:10 | 16 | | Zergling |
| Time | Supply | Image | Unit |
|---|---|---|---|
| 0:15 | 8 |  | Supply Depot |
| 0:20 | 9 |  | Barracks |
| 0:25 | 10 |  | Marine |
| 0:30 | 11 | | Marine |
| 0:35 | 12 |  | Refinery |
| 0:45 | 14 | | Marine |
Example data
Activity calendar and win rate by game length — aggregated across your uploaded replays.
Mar 1, 2026 – Mar 31, 2026
Drag sideways to change period
PvT — win rate by game length
Your Protoss games · Y-axis is win rate − 50% (0 = even).
Example data
HUD sampled every second — workers, economy, army, supply block, and more. Dashed S / S+ rank benchmarks compare Jaedong & Flash to 2300+ MMR pools.
Example data
Scrub the replay frame-by-frame — alive units, production, and losses at each moment.

Example frame · not interactive
Monthly worker-count trends with dashed S / S+ rank goal lines from deep-analyzed 2300+ MMR player pools.
Dashed goal lines show average deep-analyzed performance for S (2300–2500 MMR) and S+ (2500+ MMR) players of your selected race across all maps and matchups.
Average worker count at 5, 10, and 15 minutes.
You performed better than average S rank players on @ 5 min for 4 out of 6 months (67%).
You performed better than average S rank players on @ 10 min for 4 out of 6 months (67%).
You performed better than average S rank players on @ 15 min for 4 out of 6 months (67%).
Example data
Community
Ladder talk, replay help, feature requests, and bug reports — the swarm lives on Discord. Hop in before your next upload.
Join the Hive on Discord